While effort is made to ensure the accuracy of this information, Port Taranaki accepts no liability for any loss or damage caused by errors or omissions with respect to this information or for the use of this information for any purpose other than the operation of vessels within Port Taranaki.
For New Plymouth forecast information see the Metservice website.
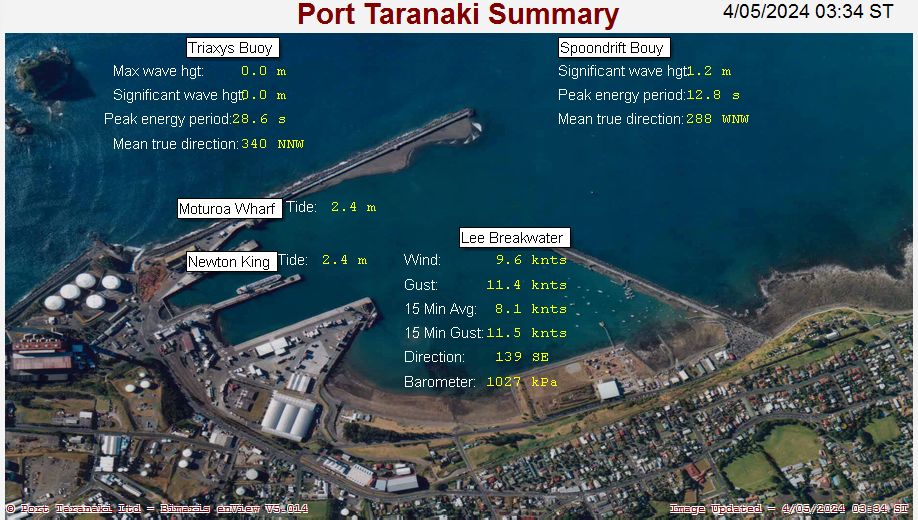
Summary
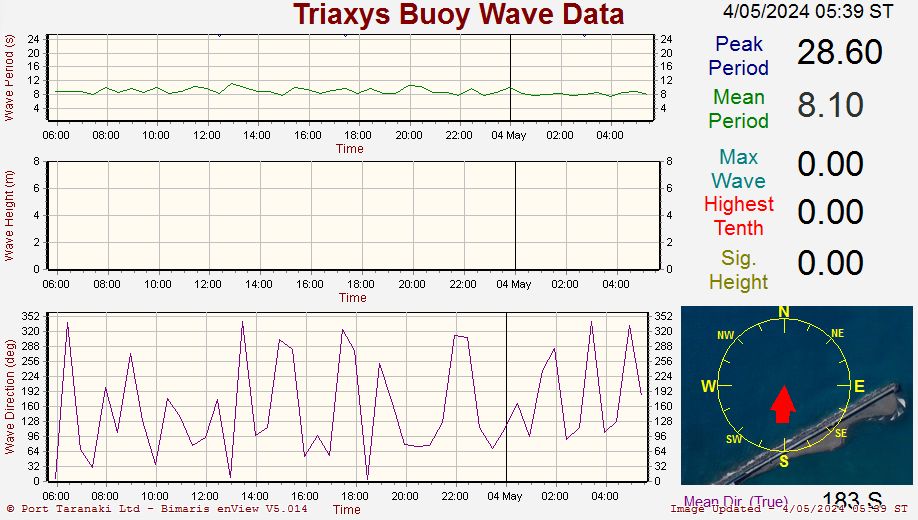
Triaxys Wave
Graphs display the wave height at the wave rider buoy 1.4km North east of the Main Breakwater.
Upper Graph displays the mean (green) and peak (blue) periods.
Middle Graph Displays the significant wave height Hs (light green), the Maximum Wave Height Hmax (light Blue) and the highest tenth Hs 10 (red).
Lower Graph displays the predominant direction from which the waves are coming.
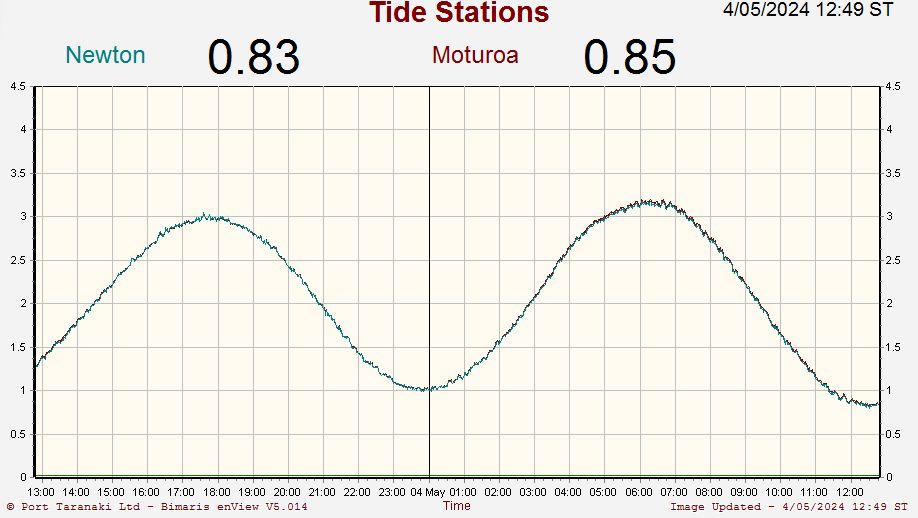
Tide
Graph displays the recorded mean water level in metres above zero datum. The display effectively shows the tide height and includes fluctuations due to pressure differentials and other variables. These graphs are measured at the Wave Tower outside the Harbour Entrance.
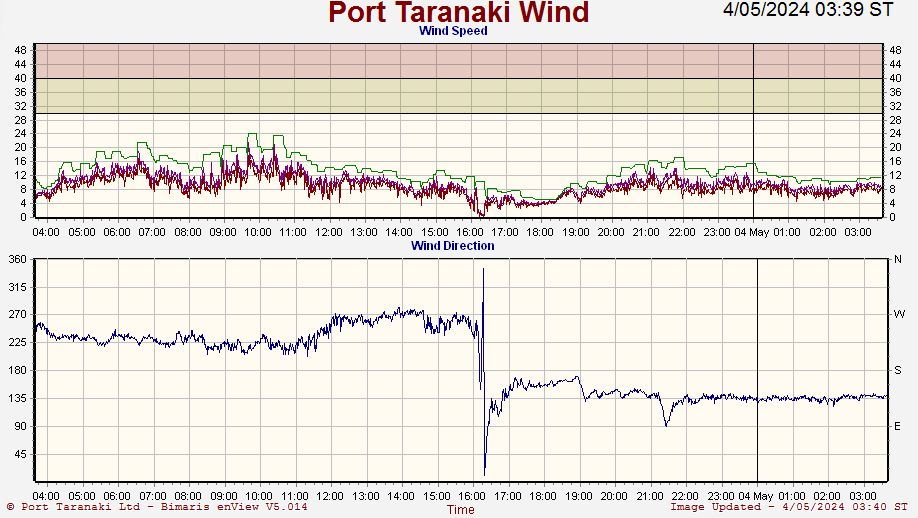
Wind
Graph displays average wind speed and maximum gust speed over the previous 24 hours.
Lower Graph displays the direction from which the wind is blowing over the same time period.
Wind is measured from an anemometer on the end of the Lee Breakwater.